Case study
How did New York home values hold up?
Following the Google Data Analytics process: ask, prepare, process, analyze, share, act. A self-directed portfolio project using public data, not a client engagement.
People deciding whether to buy or sell a home want to know how New York values compare with the rest of the country, and how they behave when the market turns.
Compare New York with every other state since 2000, and measure how it fared in the 2008 bust.
Cleaned 26 years of monthly Zillow Home Value Index data in Python (pandas), indexed and ranked the states, measured peak-to-trough drops, and built three charts.
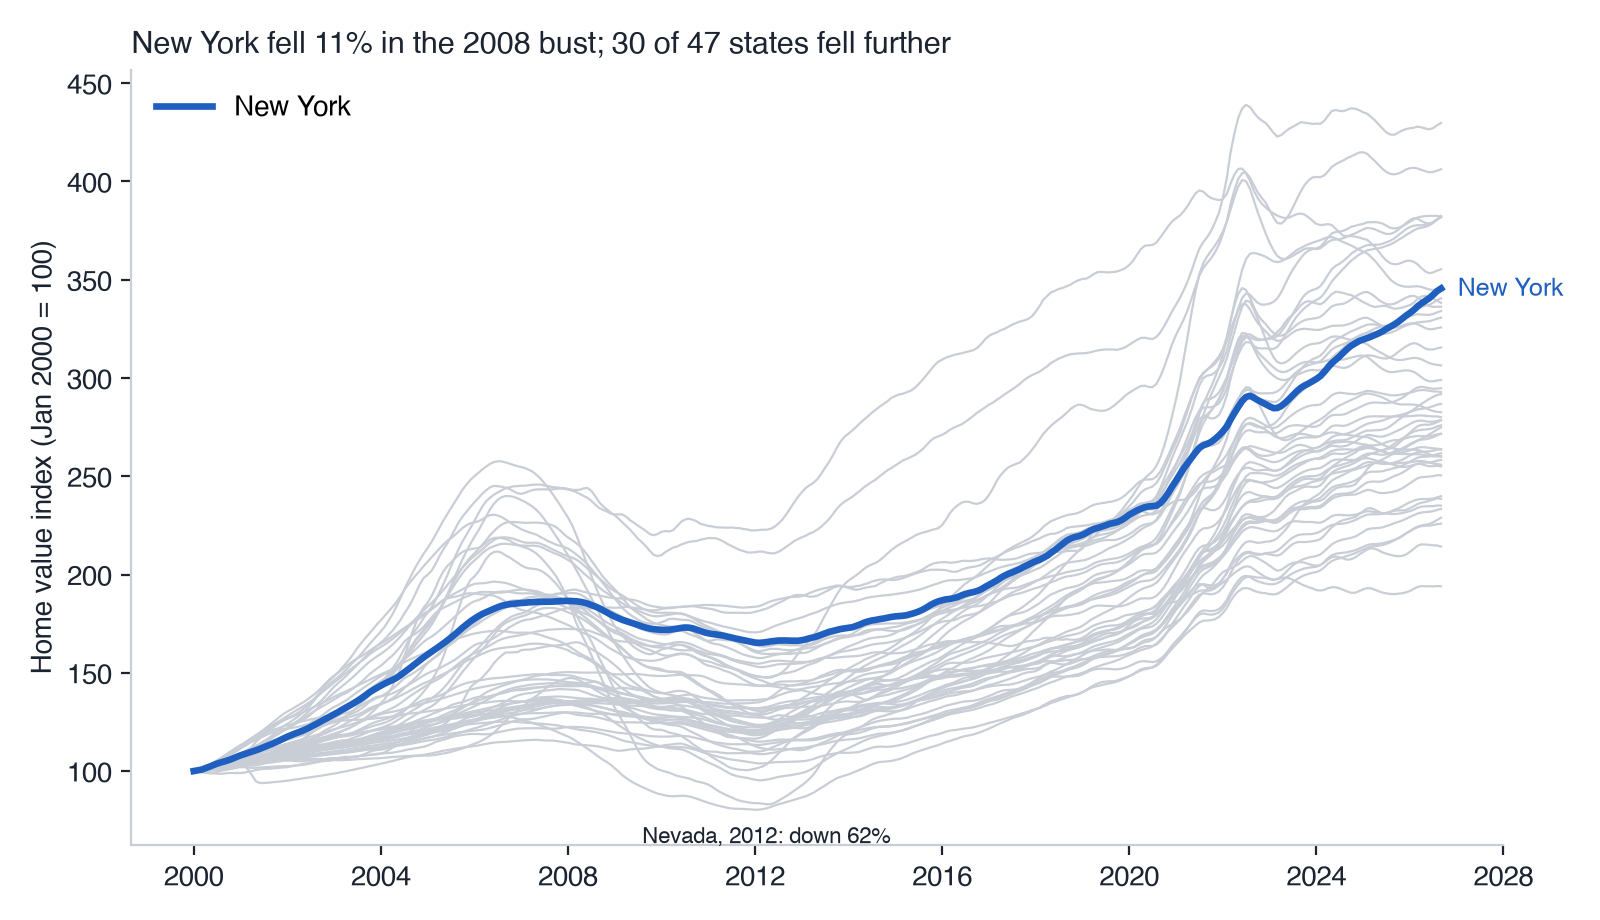
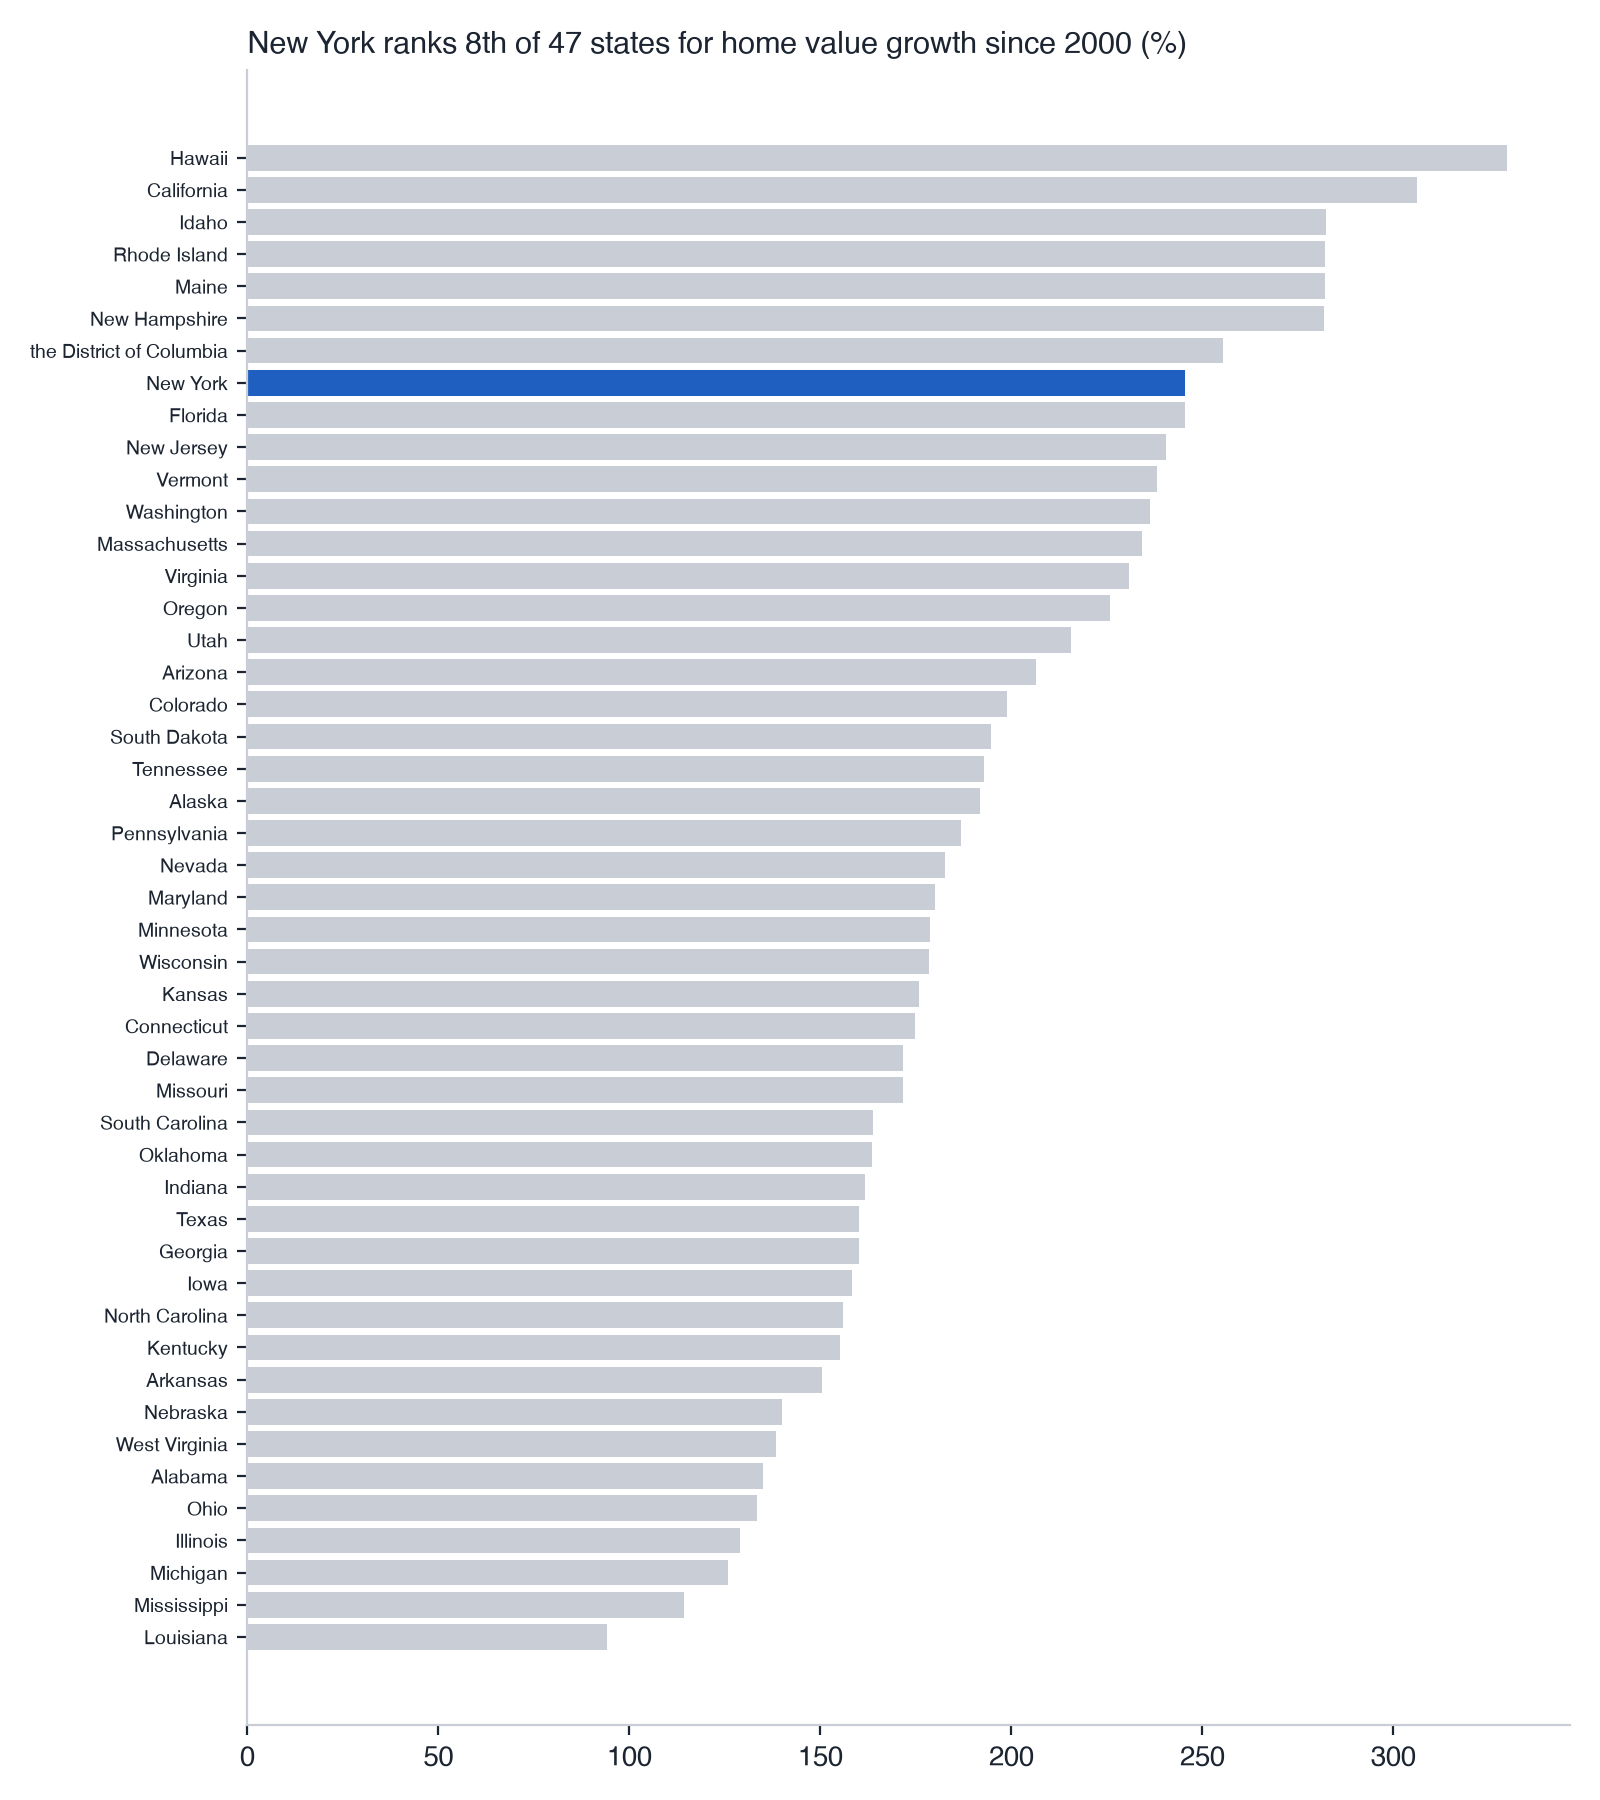
New York rose 246% since 2000, 8th of 47 states. It fell 11.4% in the bust while 30 of 47 states fell further. Since 2016 it has grown 85%, the same as the median state.
1Ask
Business task: How have New York home values performed against the rest of the US since 2000, and how well did they hold up in the 2008 downturn?
Who would use the answer:
- Buyers asking whether New York is a stable place to put money into a home.
- Sellers asking where values stand now compared with their past.
- The agent advising them (me), who needs to describe the market accurately and know what the data can't say.
2Prepare
The data is the Zillow Home Value Index (updated monthly) by Rob Mulla on Kaggle, a copy of what he pulls from the FRED API. Public domain (CC0). I checked it against the ROCCC test:
- Reliable: it comes from Zillow's published index, documented in their ZHVI methodology.
- Original: partly. It is a second-hand copy, not Zillow's own file.
- Comprehensive: no for local questions. It covers 50 states and DC and nothing smaller.
- Current: yes. It runs through September 2026 and updates monthly.
- Cited: yes. The dataset page names the source and the methodology.
3Process
- The file has 321 monthly rows (January 2000 to September 2026) and 51 columns: a date plus 50 states and DC.
- 228 cells were empty. 223 of them came from four states that start late: Wyoming and New Mexico in April 2002, Montana in February 2005, and North Dakota in January 2009. I left those four out of the comparisons that need data from 2000, which leaves 47 states.
- The other five were single missing months in the middle of a series. I filled those by interpolation, so no gap breaks a line.
4Analyze
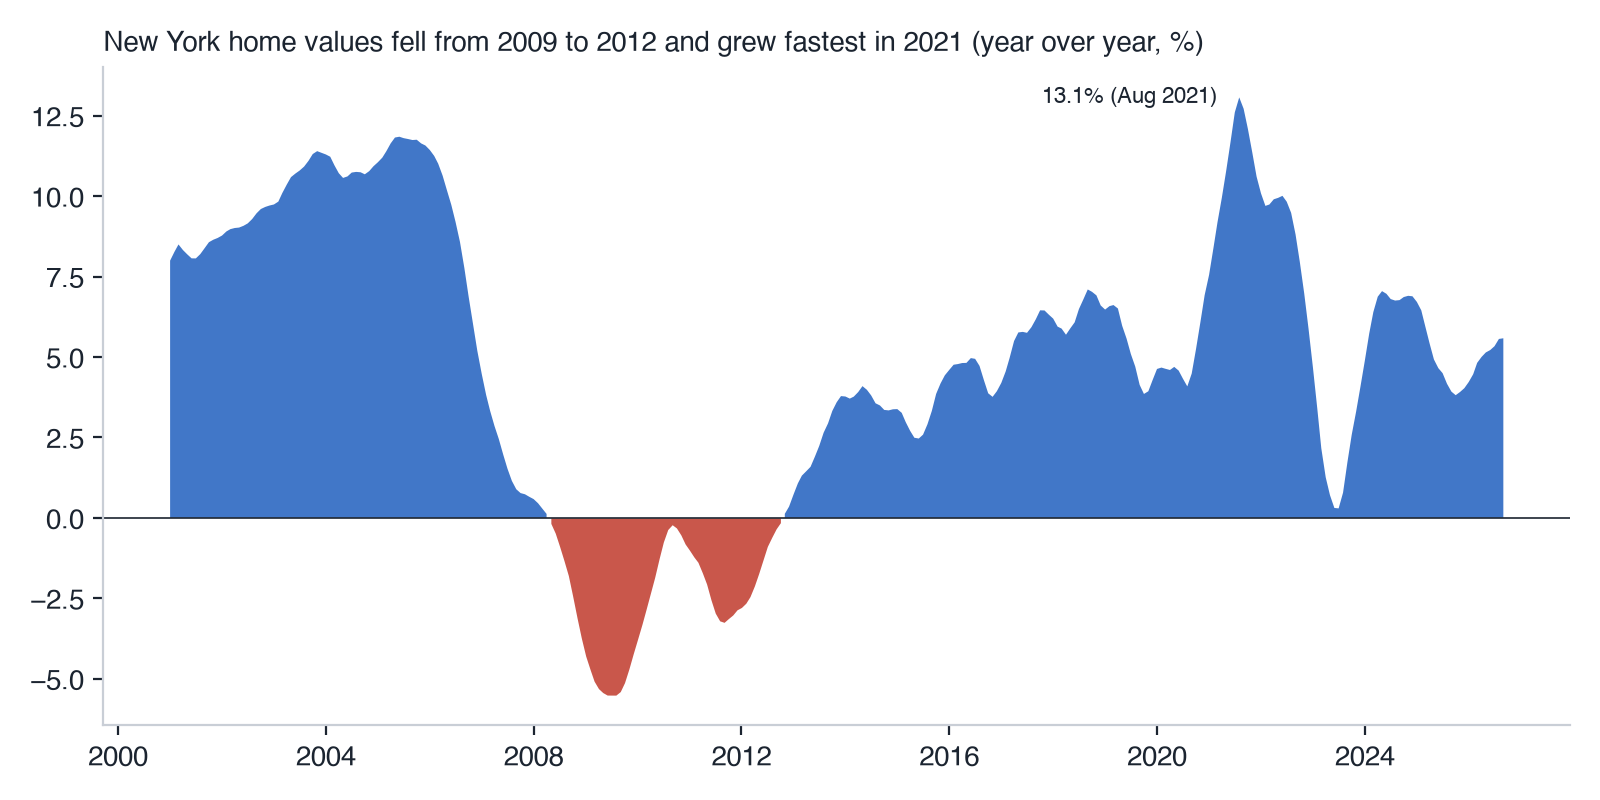
I indexed every state to January 2000 = 100 so they can share one axis. Then I calculated total growth, year-over-year change, and each state's drop from its own peak before 2010 to its lowest point afterward.
- The typical New York home went from $151,925 in January 2000 to $524,942 in September 2026.
- New York peaked in January 2008 at $283,473, bottomed at $251,037 in February 2012, and passed the old peak in January 2016.
- 30 of 47 states fell further than New York. Nevada fell 62%, Arizona 53%, Florida 50% and California 43%.
- New York's high ranking since 2000 comes from holding up in the bust. Since January 2016 it has grown 85%, the same as the median state.
- Year-over-year growth peaked at 13.1% in August 2021 and has cooled to 5.6%.
5Share
See the numbers behind the charts (table and CSV)
Download New York monthly values (CSV)
| Month | New York typical home value |
|---|---|
| 2000 | $151,925 |
| 2001 | $164,071 |
| 2002 | $178,469 |
| 2003 | $195,855 |
| 2004 | $217,981 |
| 2005 | $242,078 |
| 2006 | $269,759 |
| 2007 | $281,832 |
| 2008 | $283,473 |
| 2009 | $271,296 |
| 2010 | $261,075 |
| 2011 | $258,445 |
| 2012 | $251,246 |
| 2013 | $253,058 |
| 2014 | $262,604 |
| 2015 | $271,481 |
| 2016 | $283,962 |
| 2017 | $295,869 |
| 2018 | $314,192 |
| 2019 | $334,534 |
| 2020 | $350,017 |
| 2021 | $376,447 |
| 2022 | $414,423 |
| 2023 | $433,826 |
| 2024 | $455,001 |
| 2025 | $485,542 |
| 2026 | $506,056 |
| Sep 2026 | $524,942 |
6Act
- Use it as context, not a price. This says New York has been a steadier market than many in a downturn. It doesn't say what any one home is worth or where prices go next.
- Next step: go local. Zillow also publishes ZIP-level values. Repeating this analysis for Canarsie (11236) and nearby ZIP codes would answer what buyers and sellers there actually need.
- Add sales data. Prices alone miss how fast homes sell and how many sell. Sales volume and days on market would complete the picture.
- Refresh monthly. The dataset updates every month and the script runs end to end, so rerunning it takes minutes.
Limits: the index is Zillow's estimate of the typical home value, not actual sale prices, and it is state-level only. Past trends don't predict future prices, and nothing here is investment advice.
Capstone
Healthcare data analysis. My data analysis capstone uses a healthcare dataset from Kaggle. I loaded the data into a MySQL database running in Docker containers.